Performance testing is usually something you plan and do over time. You create a set of scripts and you run them throughout different phases of the project. You compare the results and create some reports which will show if the overall performance of the application has increased or decreased.
There could be situations where this was overlooked, and a certain project needs some performance testing done before going live, which could be really soon(3 days in the situation I’m thinking about).
The application used for the examples presented in the following paragraphs is the free open-source performance testing tool jMeter.
What do you do then?
First, you need to explain the context under which performance is usually done to the people requesting this. Then figure out if what you can do and offer in those 3 days is what that particular team is looking for. For example, you won’t have the time to create really complex scripts. Nor will your reports be the most professional. What you’ll be able to do is simulate a certain load and offer feedback about how the app behaves under that load, what the responses time are, if pages start returning errors, and so forth.
If everyone is on board with that then you can start the next phases. My process is usually as follows:
1. Information gathering
Ask relevant questions…
Figuring out what the purpose of your tests are and how you will proceed is vital. For this, we should ask the people who know most about the app some questions.
Questions like:
- Why am i doing these tests, what is the purpose?
- Do you have access to analytics data?
- What environment will my tests run and how’s that environment compared to the live one?
- How many concurrent users should the tests simulate?
- Do we have access to monitor the servers?
- What are your expectations from the tests?
will help us better understand our role and how we will create our tests. - Are there any NFR (non functional requirements) to be met ?
will help us better understand our role and how we will create our tests.
2. Determine the flows your virtual users want to simulate
Data from analytics can play an important part in this step. It can help us isolate the essential actions which we need to include in the scripts.
Also, in order to accurately simulate user behaviour, it’s a good idea to not only have 1 category of users performing the same flows. Rather try to determine a few virtual user categories, each performing a different representative flow.
For example, for an e-commerce website we could have:
• Category1: users who just use the elasticsearch functionality of the website which is usually a great consumer
• Category2: these are users who access the site, open the online catalog, and just navigate through the products
• Category3: these are users who log in to the site, navigate various categories and subcategories, and proceed with a checkout action at the end of the script
The development team might be targeting specific components (like search for example) to stress under a large load, that would not require scenario-like scripts but more feature-based scripts.
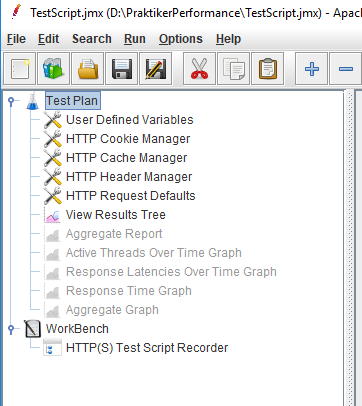
3. Prepare your jMeter script with some predefined configuration elements
Just create a new jMeter project and user the Test Plan section add some elements which will help us better simulate real user behaviour and make our job easier.
What are these indispensable elements?
- The Cookie Manager: which I set to clear cookies after each iteration.
- The Cache Manager: which is set to clear the cache after each iteration, so that each new virtual user simulates a user who has not accessed the site before.
- The Header Manager: where you set the headers which will be applied to all requests in the script.
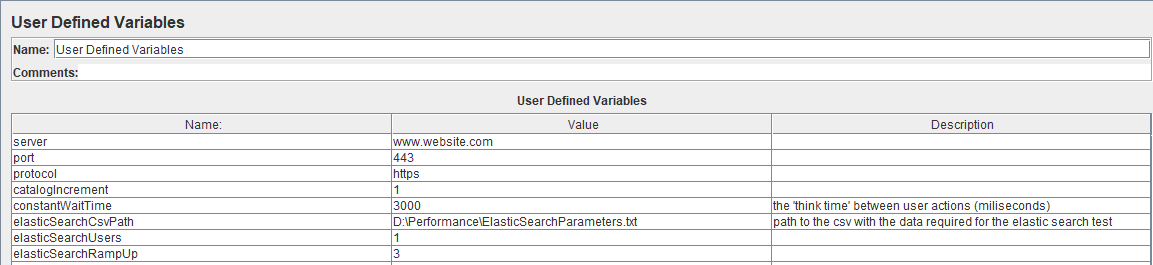
- The User Defined Variables: where you set up information like the server name, the requests protocol, specific port for those requests, etc — predefine your URL so it gets parameterized in all your elements (requests headers, etc) to make sure the script will work on other environments.
- The HTTP Request Defaults: where you set some default values which will be applied the all subsequent requests.
- A View Results Tree listener: this is used for debugging purposes.
- Various listeners: which will be commented on and will be used just for reporting purposes at the end of the run. These listeners can vary but the most common are:
- The aggregate report is where we can get most of the data we need for our report.
- Active threads over time graph.
- Response latencies over time graph.
- Response times over time graph.
- Average response times for each action graph.
- Others.
You should be consistent with the listeners you use so you can easily compare test run results.
Also, it’s a good idea to create special listeners for error logging which save errors to a different file. This is useful because it’s easier to track the specific errors which occurred and you have a lot more info than you would have from a normal .jtl report file where you only see that x% of the requests were returned with errors.
The jMeter structure will look something like this:
4. Record the user flows
Next, you have to add a Test Script Recorder which opens a specified port. Then direct all the traffic from a browser through that port — configure the browser proxy port to point to the same port your recorder is listening to. Then simply go through the flows you defined earlier.
What to do with all the recorded data?
There are a few steps you need to undergo in order to keep your script clean:
- Move each set of generated requests to the corresponding Thread Group (user category).
- Clean up your recorded data. What I mean by this is delete all the header managers under each request (since you already have a default header set up). Also, clear the Protocol, Server Name and Port number fields since they are already defined in the Request Defaults section and will be inherited from there.
- Group the requests which are triggered when performing a certain action into groups (called Transaction Controllers). Each transaction controller represents an action and it can have 1 or more requests attached to it. Transaction controller corresponding to a particular action should have the ‘Generate parent sample’ field checked so we get the response times for each action, not individual request.
- Give each individual request a suggestive name like [METHOD]SuggestiveName ([GET] Navigate to Homepage for example).
- Add assertions to the main actions. For example, if a requests navigates to the ‘My shopping list’ page and that page contains that particular text (‘My shopping list’), you should add a response assertion under the request which checks that the text is displayed on the page.
- Add a timer under the last request of each Transaction controller which simulates the user ‘think time’.
- Check the ‘retrieve all embedded resources’ and set the ‘Parallel downloads number’ to 6 if you want to simulate a Chrome or Firefox browser or 13 if you want to simulate an Edge browser.
- Exclude requests from 3rd party services like CDNs. You can use a structure like ^((?!googleapis|amazon).)*$ in the ‘URLs must match’ field which excludes requests from googleapis and amazon.
- Add suggested excludes to avoid retrieving resources on subsequent requests.
5. Parameterize the script
I’ve mentioned earlier the User Defined Variables and Request Default configuration elements. These 2 help a lot when it comes to parameterizing our script since we can define a set of values in the first configuration element and call those variables like server name, protocol, and port in the Request Defaults section.
Why is this way of working efficiently?
Because you only need to make a few changes in one location to test the same application in a different testing environment. You don’t need to go through each request where those variables are used and edit them.
Here’s an example of a user defined variables file:
6. Make all your requests dynamic and remove all hard-coded data
While you record your script, all data from a request, the path for example, or parameters sent in the body of a request are hard-coded.
You need to isolate dynamically generated elements, like a form key or some product id. Then you must extract them from the appropriate requests and call them wherever they are used.
A quick example would be an ‘add to cart’ POST request, which needs some specific parameters sent in order to add the correct product to the cart. For each individual product, there is a unique product id and form key which we extracted using regular expressions from a previous request and later used them on the ‘Add to cart’ request, in the request PATH & parameters which we have to send in order to simulate the request accordingly:

7. Run your tests
This is the easy part…
Running performance tests in GUI mode can waste a lot of resources and lead to artificial bottlenecks. So, you should run all of your tests via the command line instead. Before you run anything make sure all your listeners are commented on since they eat up lots of resources.
The syntax for running via cmd is ‘jmeter -n -t path\to\the\script\Script.jmx -l generated\results\path\FirstRunScriptResults.jtl’. This will generate a .jtl file with all the aggregated results data which you can later use to generate some nice graphs and visualize all results.
If the client wants to test if his app can run with N concurrent clients, don’t start with that…
It’s a good idea to run your tests with 1 user so you can get a baseline. Then you gradually start to scale up and see how much load the app can take, you might not even get to run with 300 users if the response times with 50 users are really high.
Before starting a test run, make sure you select an appropriate name for the generated .jtl file based on the configuration you are running (you could include the current time, the thread count, the execution number etc).
8. Make your report
After each run, you will have a different .jtl file generated. You can import those files into the listeners you commented earlier and some graphs are automatically generated. Those graphs can be exported as PNGs and then used in your report, where you can compare how the app behaves with 1,10,50,100 and hopefully N users if you got that far without anything breaking.
Considering the small timeframe we have for running and reporting these tests we won’t have time to create a professional report.
What do we report then?
We have to focus on the important aspects which give context to our results. We should mention things like:
- Script and execution notes (regarding the cache settings, resources, simulated types of users and their flows, execution times etc).
- Environments on which we ran the tests
- General notes and glossary of terms where you can explain what the latency is, errors from your reports, samplers, average etc
- An overall summary of the results you got and general observations from during the test execution.
- Of course, the graphs and results files you generated during the execution
Having said that, you now have a simple test script and report that you can share with your team. Of course, the script can be extended, optimized, and reused for further testing but considering the very small time frame, this will have to do for now.
by Dragos Campean
This article was originally published here.