Even though app usage on desktop devices has maintained a steady leader position, over the past few years, mobile devices have been gradually gaining ground. It is safe to assume that this trend will continue on its trajectory.
For this reason, the IT industry invests more and more in this sector. New technologies and innovative apps are available each day. Usage for these apps is also growing exponentially and for this reason, the testing effort must improve and keep up as well. The purpose of this article is to cover a few key points:
- Explore 2 really useful tools: Fiddler and JMeter
- A better understanding of how requests from a mobile device look like
- Understand what happens “behind the scenes” while performing certain actions in the app UI
- Better isolate certain bugs and determine if they are backend or UI bugs
- Gain some insight into how to create some automated API tests which should not take too long to design and maintain – this would bring a plus value for the testing effort on a project and it could be a first layer of protection before some more complex end to end UI automated tests are created
So, let’s get into it!
Before starting the actual practice, we need to understand a few basic concepts (like proxy). Also, understanding what each application we are going to use does, is an important factor. And to see if there are any requirements for that app to work on your system.
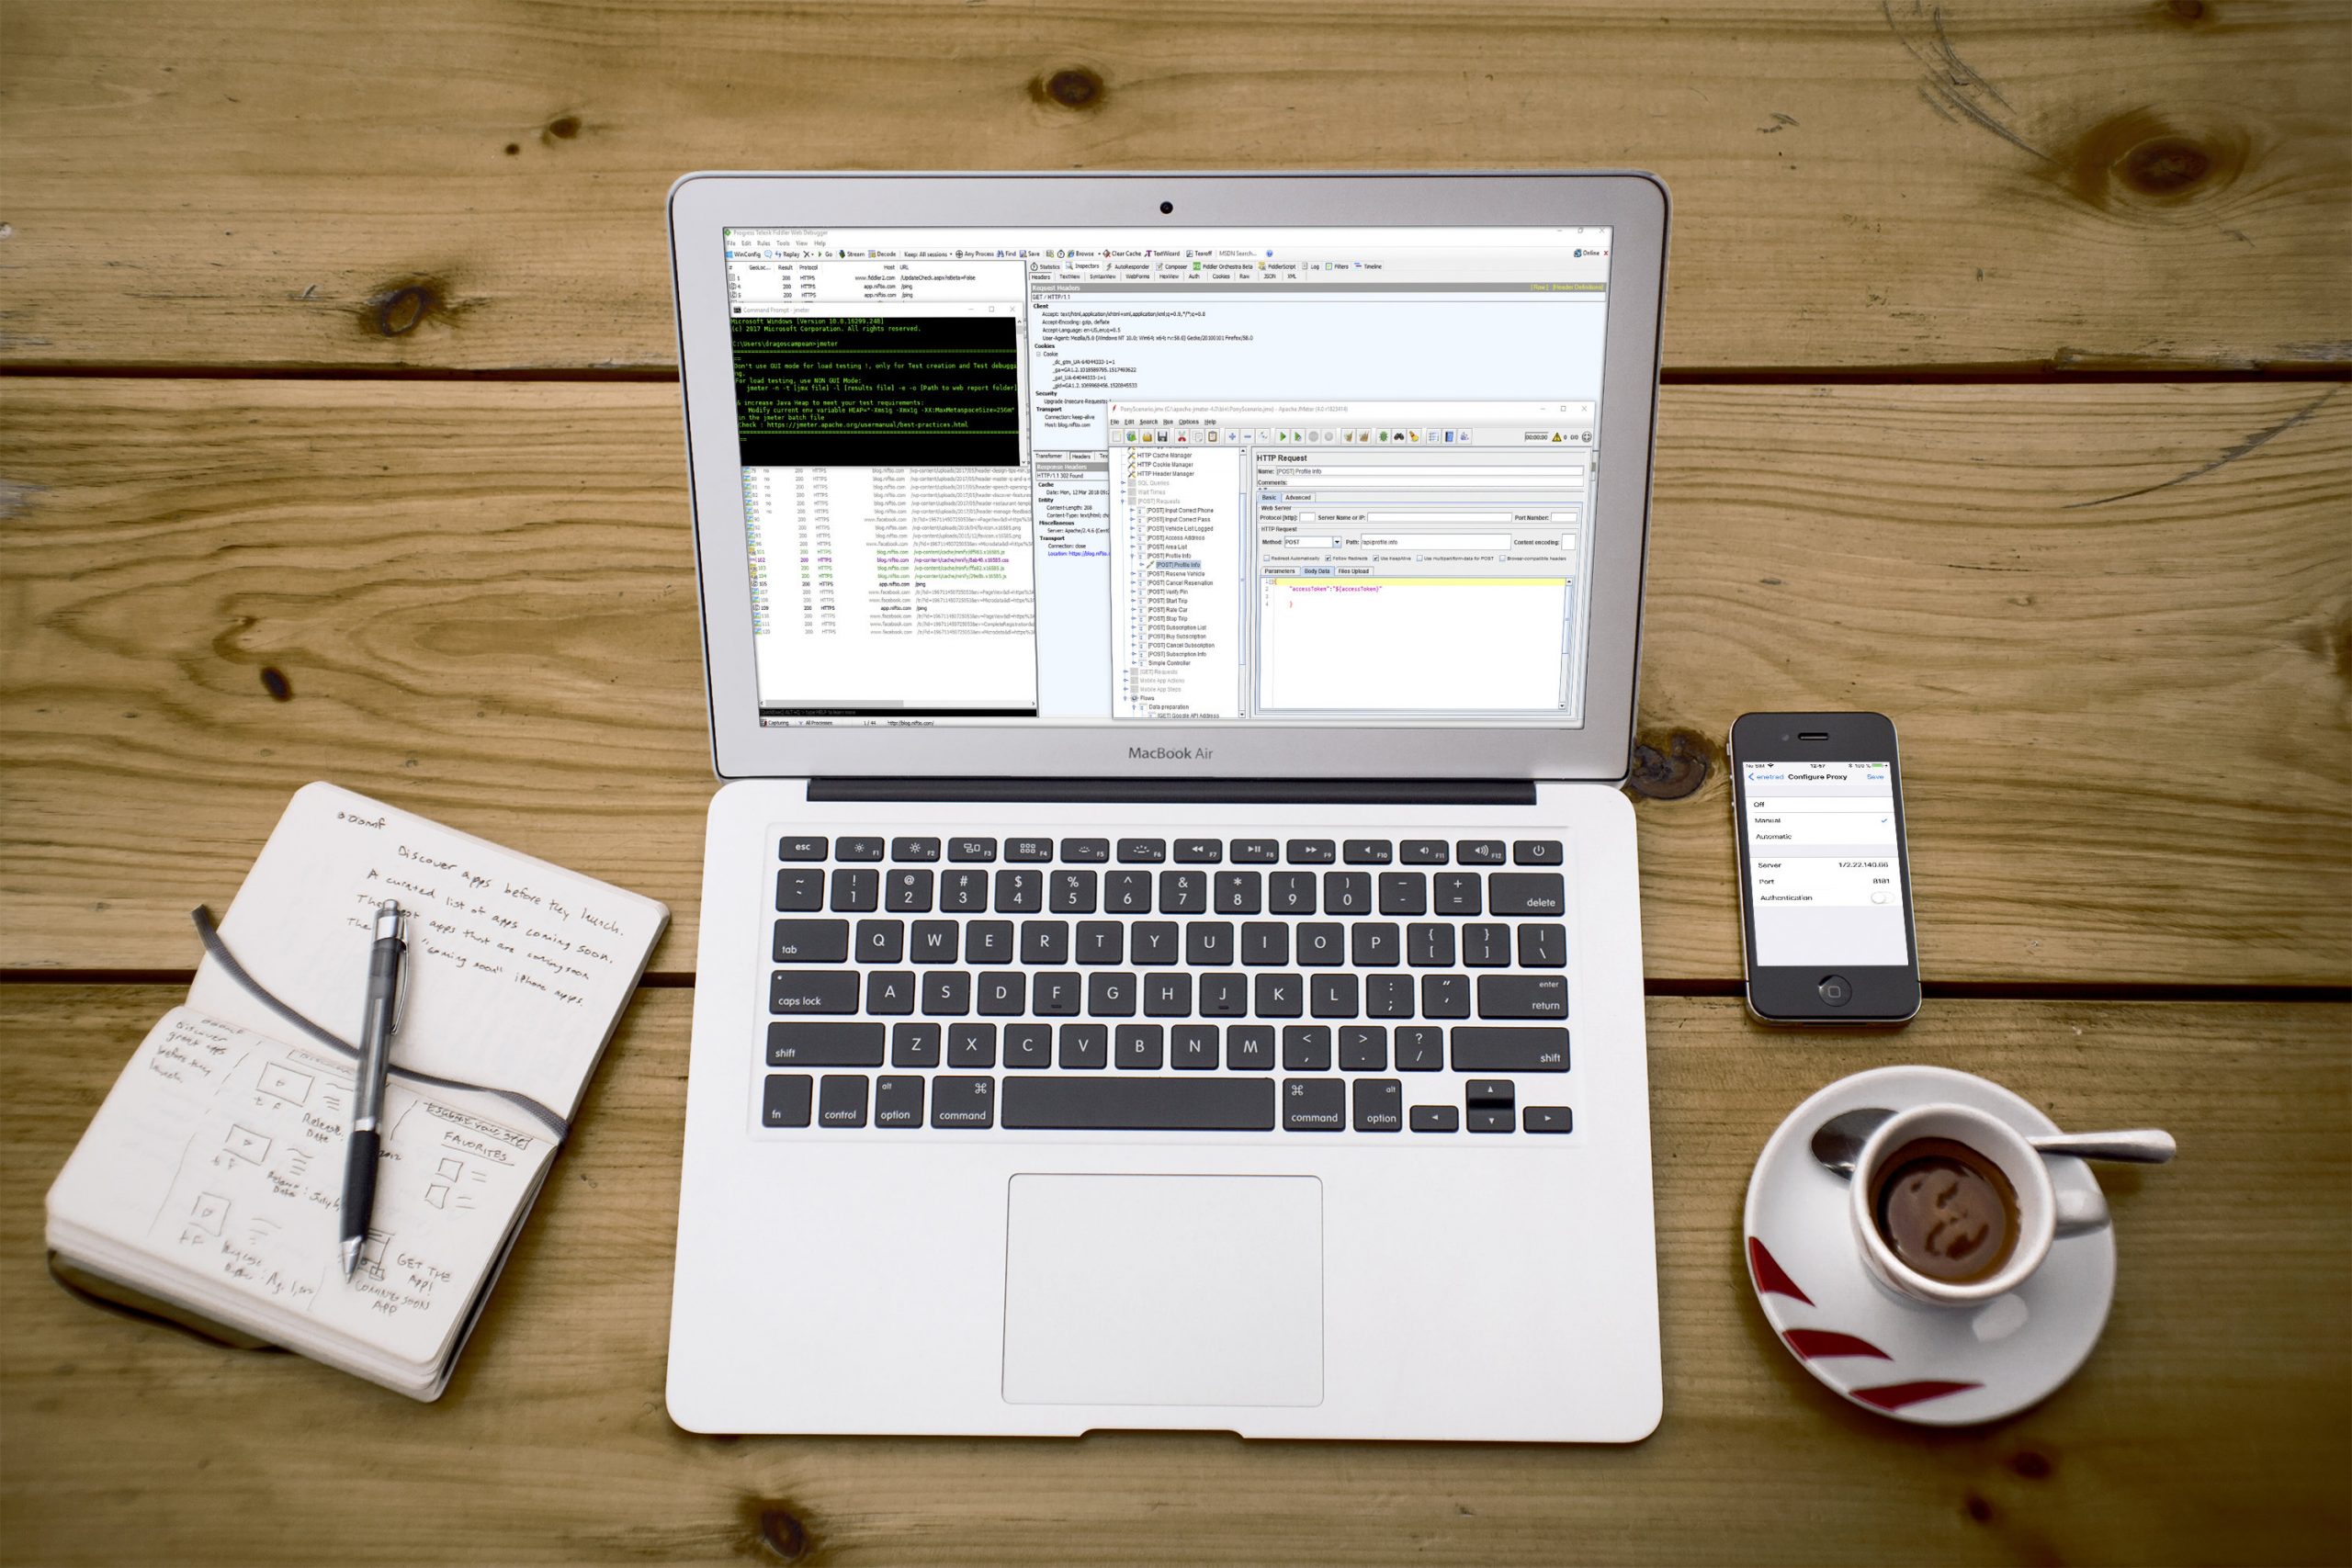
Also, for the practical part, we will need a mobile device (Android or iOS) and a PC/ Laptop/ Mac.
I. What we need
Fiddler
Fiddler is a powerful web debugging tool usable for multiple operating systems (Windows and Mac OS) and devices (PC and Mac).
In the current context, it will only be used for web debugging. But, it can also be used for recording HTTP/HTTPS traffic. It can also be used for performance testing, web session manipulation, and security testing.
Apache JMeter
JMeter is an open source testing software. It was created by the Apache Software Foundation in 1998. The application is 100% Java-based (runnable on most major operating systems). And it’s mainly used for load testing, analyzing, and measuring the performance of web services. It is also used for stress testing and to determine the maximum load capacity of a server.
In the current context, we will not be using it for performance testing. We’ll use it for creating a script that is designed to test certain functions of an API.
Java Software
Java is a programming language and a computing platform. Many applications and websites will not work properly if we don’t have Java installed. This is the case for JMeter as well. We need Java in order to be able to run JMeter.
Up until JMeter 4, which was released on 10.02.2018, Java 8 was required for the app to run. But starting with version 4, JMeter is compatible with Java 9.
The Mono framework (for Mac users)
In order to be able to run Fiddler Beta on MacOS, Mono is required. Fiddler was initially designed only for Windows platforms, and that’s where Mono comes in.
Mono is an open source project designed with the purpose of running Microsoft .NET applications cross-platform. This software platform can run on most software systems like Android, Linux, and MacOS. So, we will need it in order to run Fiddler on Mac devices.
Understanding the concept of Proxy
A proxy server is an intermediary for requests which travel from client to server and vice-versa. A proxy can exist on the same machine as the client or server. It can also exist on a separate machine. This is the case for the setup we are going to use in the current context where we will have a client (mobile phone with an application we want to debug), a proxy server (our PC or Mac), and a Server (which communicates with the client).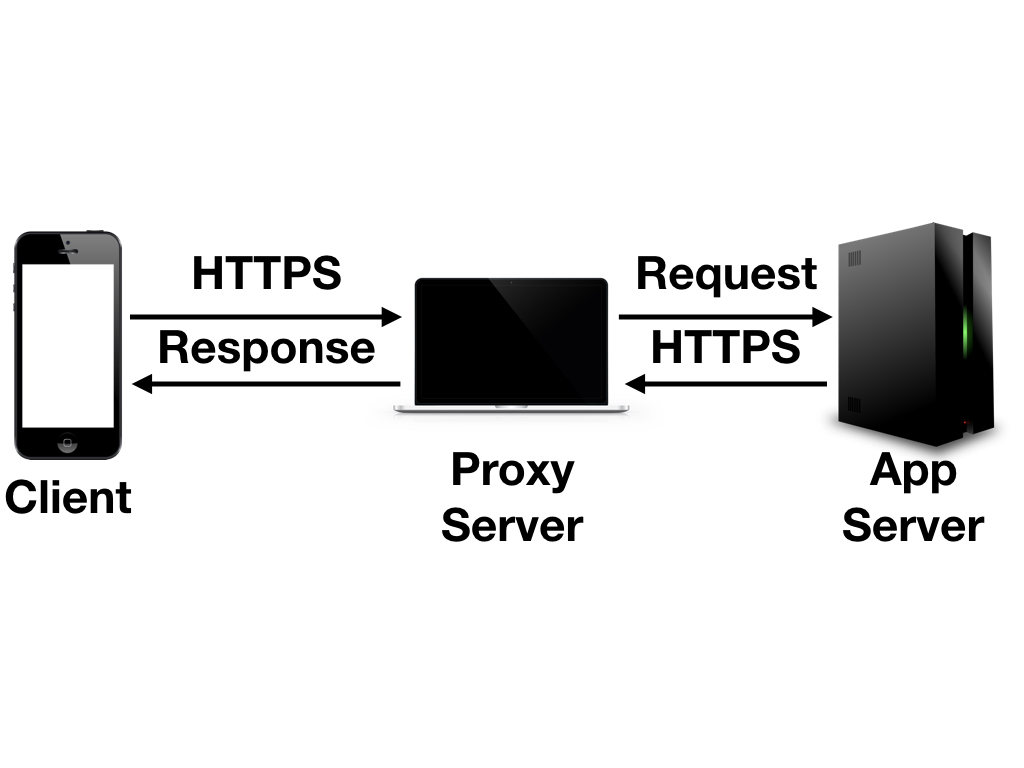
Advantages of a proxy include the fact that proxy server caches can serve all users of a website which should improve response times for that user. Also, proxies are used to protect privacy by granting anonymity on the WWW or just for bypassing restrictions to some sites which only offer content to users matching a particular IP (Youtube is a good example which restricts access to some videos in certain countries and that can easily be bypassed).
There are 2 types of proxies – forward proxies or gateways and reverse proxies. In the current context, we will be using a tunneling proxy or a gateway which basically gives us visibility to the request exchange between a mobile phone with a certain app using the internet and the server it communicates with.
Having gone through this theoretical part we can now get to the practical part.
II. What we should do
1. Install Java
- You probably already have Java installed. If you don’t, you need to do just that (it’s a simple process on both Mac and Windows).
- After that, you need to set the environment variables for Java (the classpath). The article won’t cover a step-by-step guide of how to do this, but you can find plenty of information on how to do it on Windows here and for MacOS here.
- If everything was set correctly, when you type ‘java -version’ in the terminal or cmd you should see something like:
“java version “1.8.0_131”
Java(TM) SE Runtime Environment (build 1.8.0_131-b11)
Java HotSpot(TM) 64-Bit Server VM (build 25.131-b11, mixed mode”
2. Install Mono (Mac users)
In case you are working on a Mac, you will need to install Mono before trying to run Fiddler.
- First, you need to download and install Mono. If it’s already installed on your system, you should update it.
- In order to see if Mono was installed correctly, you need to run the ‘mono –version’ command and see if the installed version is the latest one.
- After that you need to run the following command in the terminal: “sudo /Library/Frameworks/Mono.framework/Versions//bin/mozroots –import –sync” which basically imports some certificates into the trusted store, certificates which Fiddler will use (you avoid constantly getting certificate warnings).
3. Install Fiddler
- The first thing you need to do is download Fiddler from here.
- The Windows installation is basic (next -> next -> finish format after launching the .exe file).
- For Mac, you need to download the .zip. Then, you need to extract the .zip to a folder you currently have write access to.
- Then, open the terminal and change the path to the directory where you unzipped Fiddler, in the folder containing ‘Fiddler.exe’ and type “sudo mono Fiddler.exe” (according to the Fiddler official documentation). I have encountered an issue on a few MacOS systems that this command generated an error and I needed to run mono in 32-bit. You can do this by using the following command in the terminal: “sudo mono –arch=32 Fiddler.exe”.
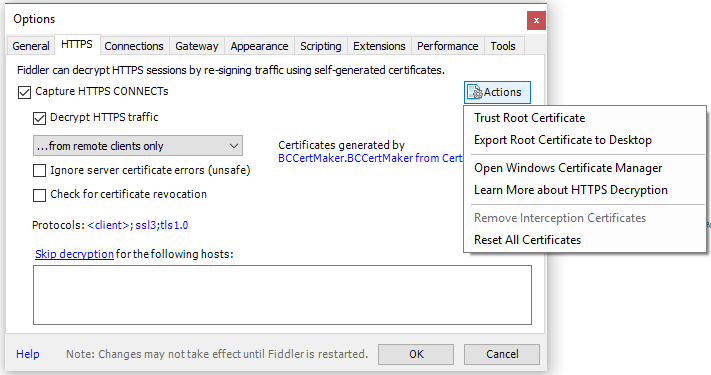
- In order to decrypt HTTPS traffic, a few extra steps are required for both Windows and Mac users. You need to navigate to the “Tools -> Options…” menu. There you need to check the ‘Decrypt HTTPS traffic’ checkbox. Then you need to press the ‘Actions’ buttons. You should see this:
- On Windows, you need to click ‘Trust Root Certificate’ and then accept to trust the fiddler certificate.
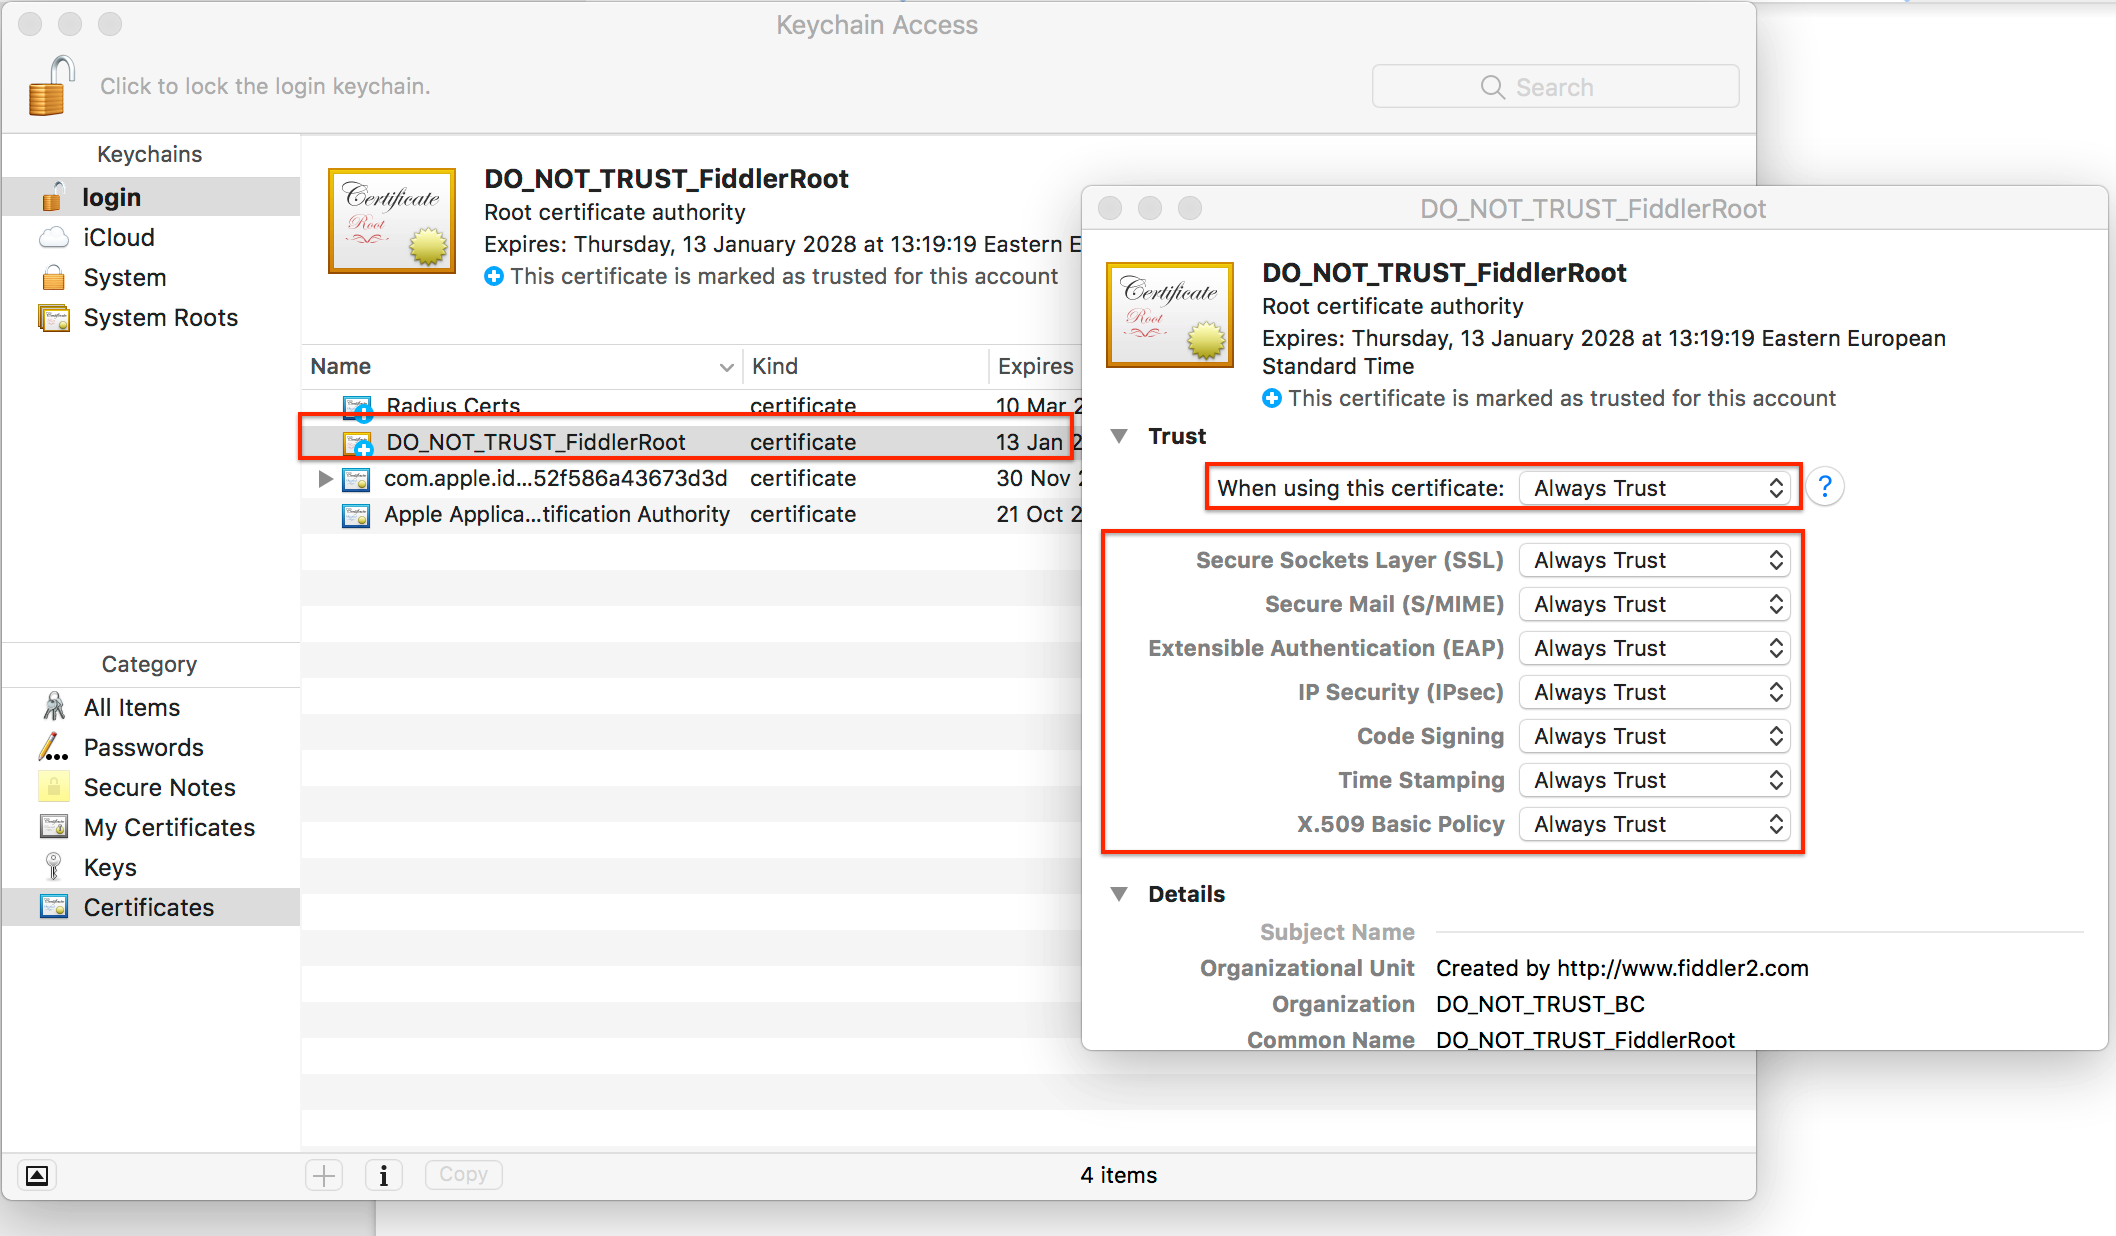
- On Mac devices, you need to ‘Export Root Certificate to Desktop’. Then, open the exported certificate and add it to the Mac keychain. From there you need to trust the certificate in the keychain and everything is set.
- One last step for both operating systems would be to import the exported Fiddler certificate into Mozilla’s trusted certificate section. I suggest using Mozilla if you want to do HTTPS web debugging since it’s really easy to import the certificate and change the proxy to match whatever you set in Fiddler. To do this, simply open the Firefox ‘Certificate Manager’, navigate to the ‘Authorities’ section, and import the Fiddler certificate. You should see this modal popping up:
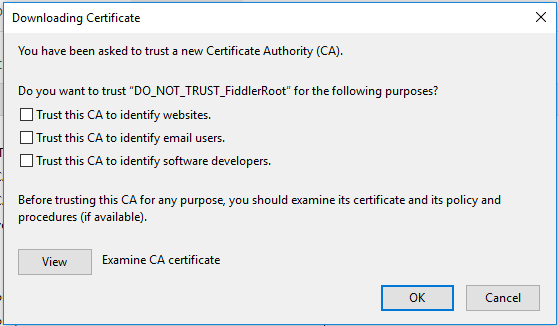
- Tick all 3 checkboxes and press ‘OK’. After this step, you should no longer see certificate errors popping up in your Firefox browser when trying to decrypt HTTPS requests.
4. Install JMeter
- The installation steps for JMeter are really simple, you simply need to download the JMeter zip from here. Unzip it and you’re basically set.
- For Windows, you need to launch the jmeter.bat file and for Mac the jmeter.sh one. For Mac users, you first need to open a terminal. Then, navigate to the folder where JMeter is installed (“cd /path/to/JMeterFolder”) and run “jmeter.sh”
- A useful trick to launch JMeter faster would be to add the path to JMeter to the system variables. For Windows, the steps are exactly the same as they are for Java. For Mac you need to run a command like “echo ‘export PATH=$PATH:/Users/myUser/path/to/apache-jmeter-x.x/bin’ >> ~/.bash_profile”. Then, you simply open the cmd or terminal and type ’jmeter’. Voila! The app is launched.
5. Setup the Fiddler proxy (phone and PC/Mac side)
There are a few extra steps we need to undergo here:
- In Fiddler, navigate to the ‘Connections’ section (“Tools -> Options…”).
- Set a port you want to use (make sure it’s not something already in use).
- Check the “Allow remote computers to connect”.
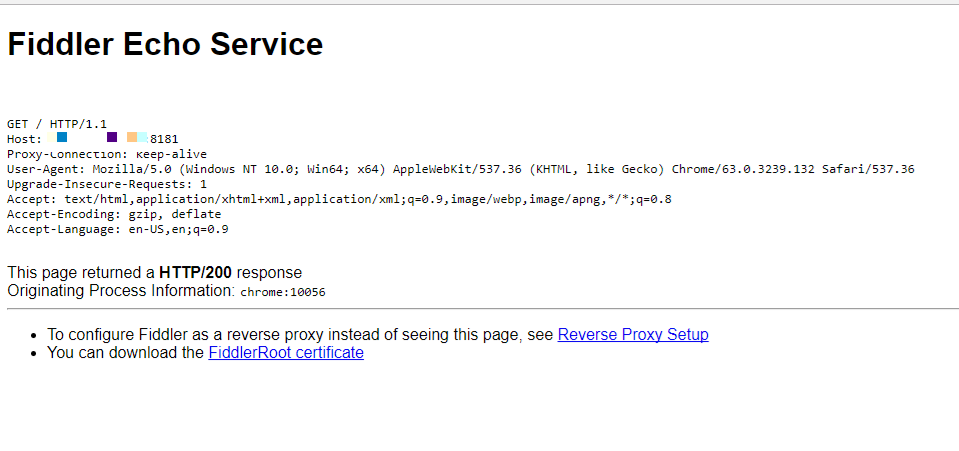
Verify if everything so far was set correctly. If everything is in order, then by opening the following URL in your browser: myIP:setPort (example: http://172.19.221.49:8181/) you should see the Fiddler Echo service.
If you don’t see this page, then the port is not open and you need to retake the previous steps carefully.
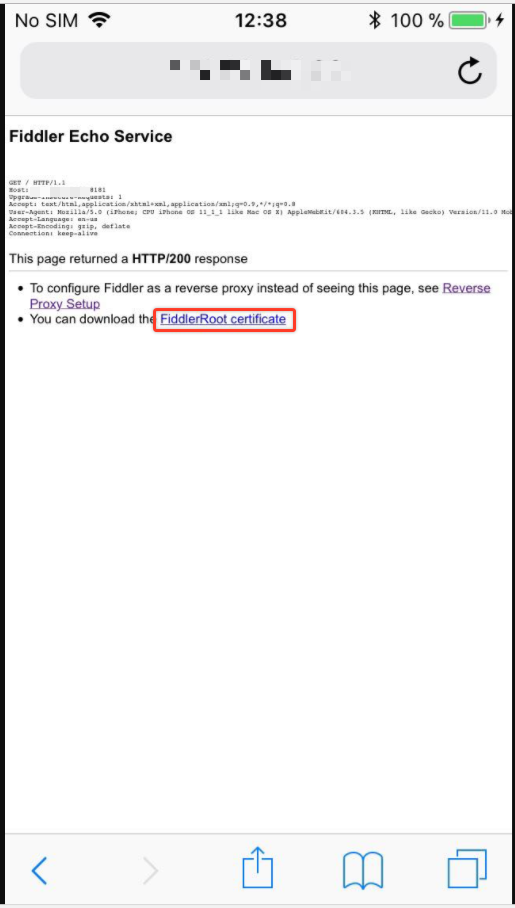
- Access the same URL on the mobile phone you want to capture requests from.
- Tap the ‘Fiddler root certificate’ and install the certificate on Apple devices and download it on Android devices:
- The installation process is straightforward for Apple devices (Allow -> Install -> Install -> Done).
- For Android phones: after you tap the ‘FiddlerRoot certificate’ you will probably get an installation error. You need to manually install it by navigating to the ‘Install certificates’ section in the ‘Certificate management’ screen. Tap ‘Install certificates’ and navigate to the folder where the root certificate was downloaded from the Fiddler echo page. Select the .cer file, name the certificate, and tap ‘ok’.
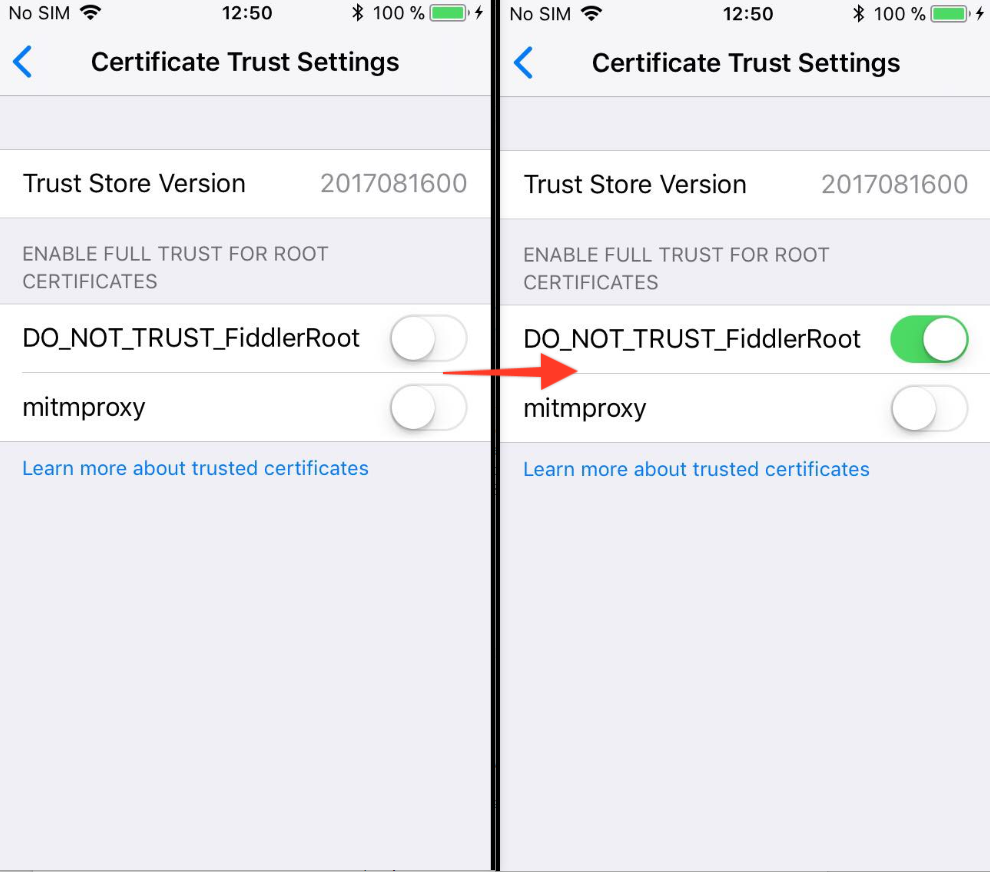
- Enable the certificate on Apple devices. These devices require one additional step. You need to go to the ‘Certificate trust settings’ and enable the freshly installed certificate:
- Set a manual proxy: This is the final step before we can actually start recording traffic going from and coming into our phones. Navigate to the ‘Wifi’ section. Select your current wifi network, and configure a manual proxy. The server field should be the IP address of your proxy server and the port should be the one which you set in Fiddler during the previous steps.
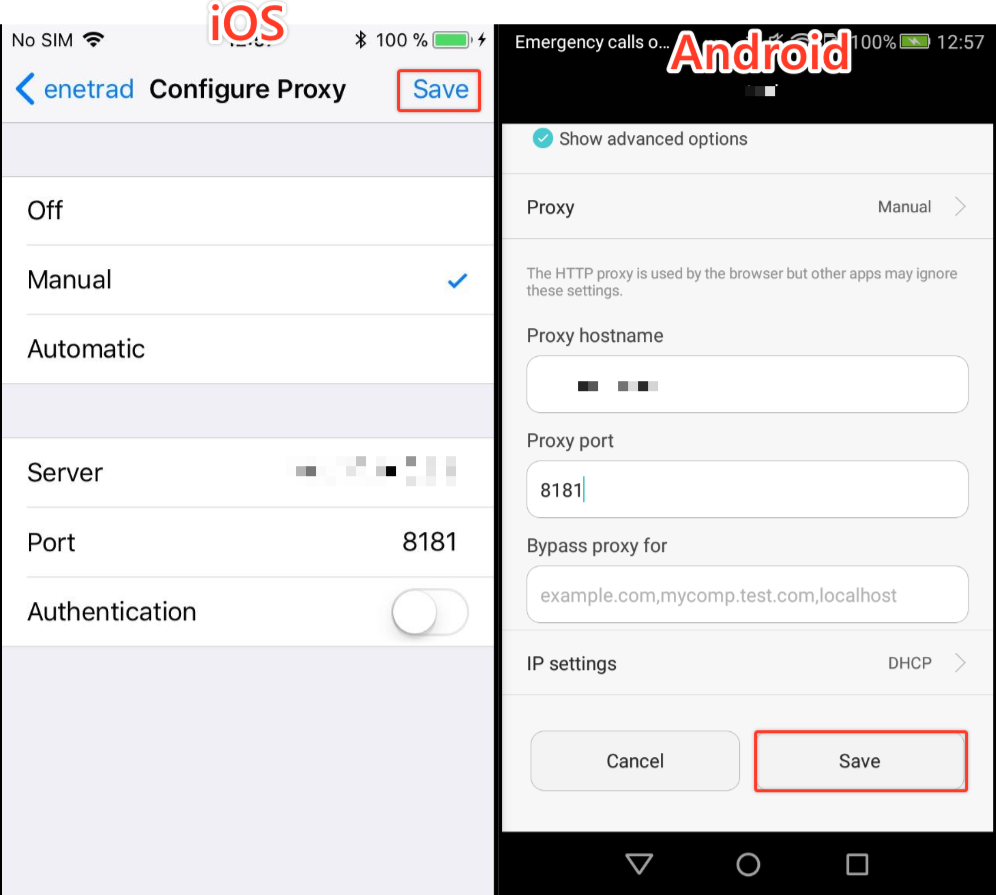
Important!
It is important to note: now, that you have a proxy set, the minute you close Fiddler, the port is also closed. This means that your internet connection won’t work on your phone unless you reopen the port, or unless you remove the manual proxy setting and change it back to automatic.
Also, if you choose to do so, you can remove the installed Fiddler certificate on both your iPhone and Android devices.
6. Inspect requests and create a JMeter script
After we performed all these steps, we can start debugging the requests from the mobile app we are interested in.
My suggestion would be to set a filter on Fiddler to only display requests from a certain domain. If we do this, we avoid cluttering the workspace and getting overwhelmed by too many displayed requests (since Fiddler will capture all requests ingoing from our phone).
- To set a filter, navigate to the ‘Filters’ tab. Check the ‘”Use filters” option. Then, check the “Show only if URL contains” where we can set the domain name or part of the domain. Below you can see the required settings:
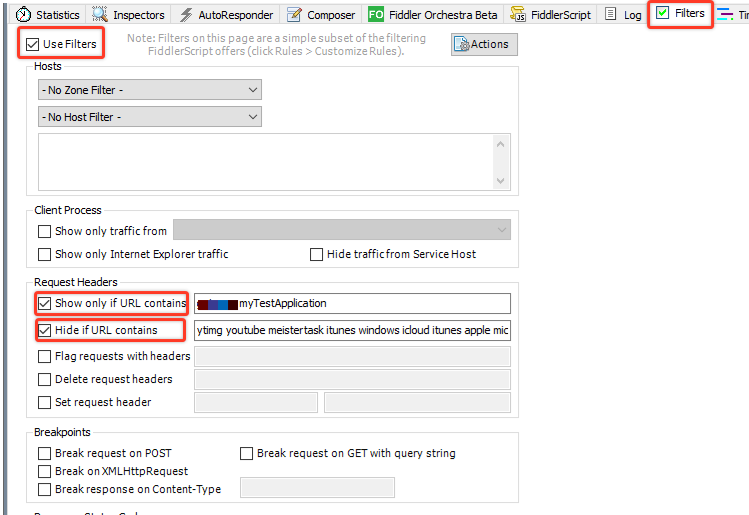
An application could use multiple APIs. It can use an API from Google or Facebook. This means that all calls ingoing to Google or Facebook will also be displayed in our Fiddler interface. If we want to exclude certain requests from the interface, check the “Hide if URL contains” box and add certain domains to your ignore list. That means that calls from that domain won’t be recorded.
- Whenever you perform a certain action in the app you are testing, one or multiple requests will be launched and Fiddler will capture all these requests.
- To inspect a certain request, just select it from the capture list. Then click the “Inspectors” section and you will see the request data in the top right sector of the screen and response data in the bottom right side.
- You can select what to view from your requests (the headers, cookies, request/response body etc).
All the information about a request and its response can be found here. The screenshot below depicts the steps mentioned above and elements from the Fiddler UI:
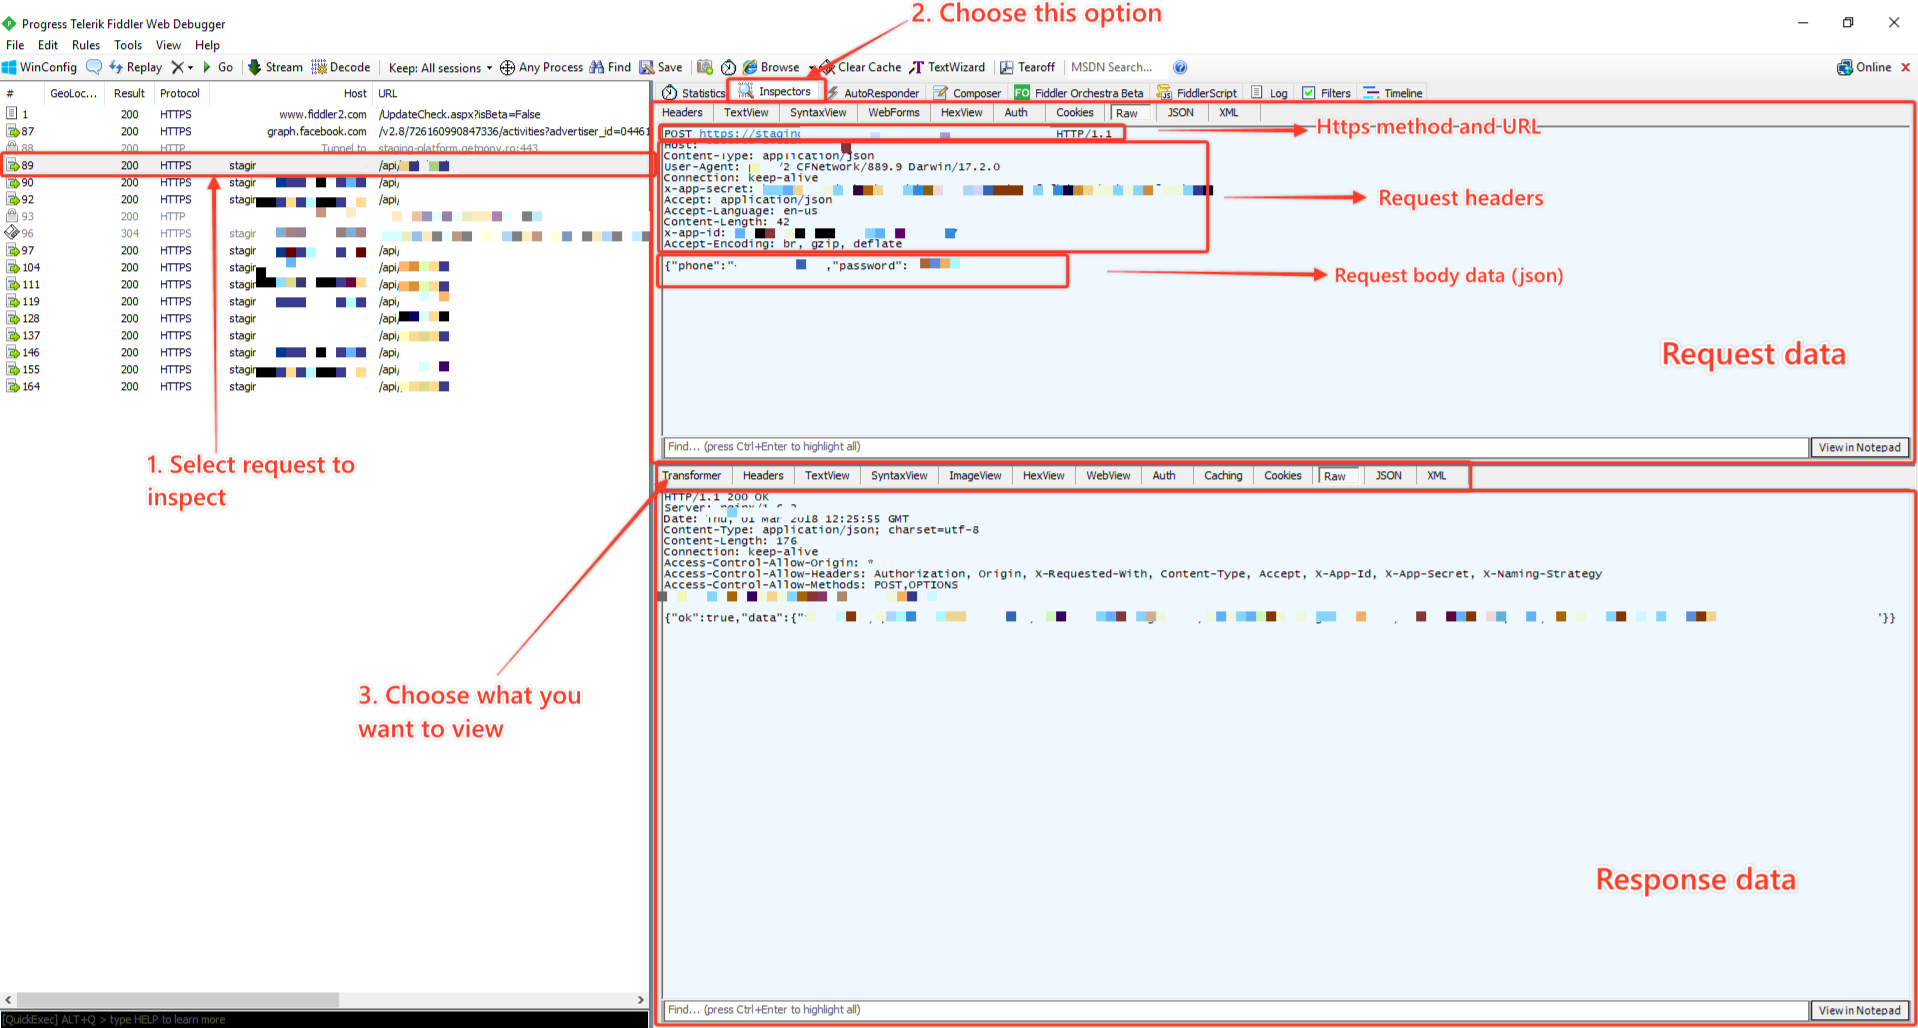
We can see in the example request, that the request body is in json format and the response is also a json. This means that the application uses a REST API. If the screenshot above is not visible, try to view it from here.
7. Create a script
Now that we know what each request looks like, we can move to simulate these requests into JMeter. Since this is not a JMeter basic tutorial, we will not undergo the basics of this tool and jump directly to the practical part.
We will, on the other hand, go over a sample script and briefly mention all elements included in it. The sample script which is a JMeter .jmx file can be found here.
All the data present in the dummy script is fictive and I changed everything from the original script that might be sensitive information. Before moving to the next step, make sure you open the .jmx with JMeter and see all elements of the script.
Important! The script contains some elements which don’t come by default with JMeter. You need to install them. To do this, simply download the JMeter plugin manager from here and move the .jar file to the JMeters folder in /lib/ext. If you are using JMeter 4, the next time you launch the app and try to open the .jmx. The missing elements will automatically be installed.
For the sake of learning, let’s imagine we are building an API functional test for a mobile booking app. That’s what the above script is for.
The script has 2 main sections: the configuration section and the functional test section.
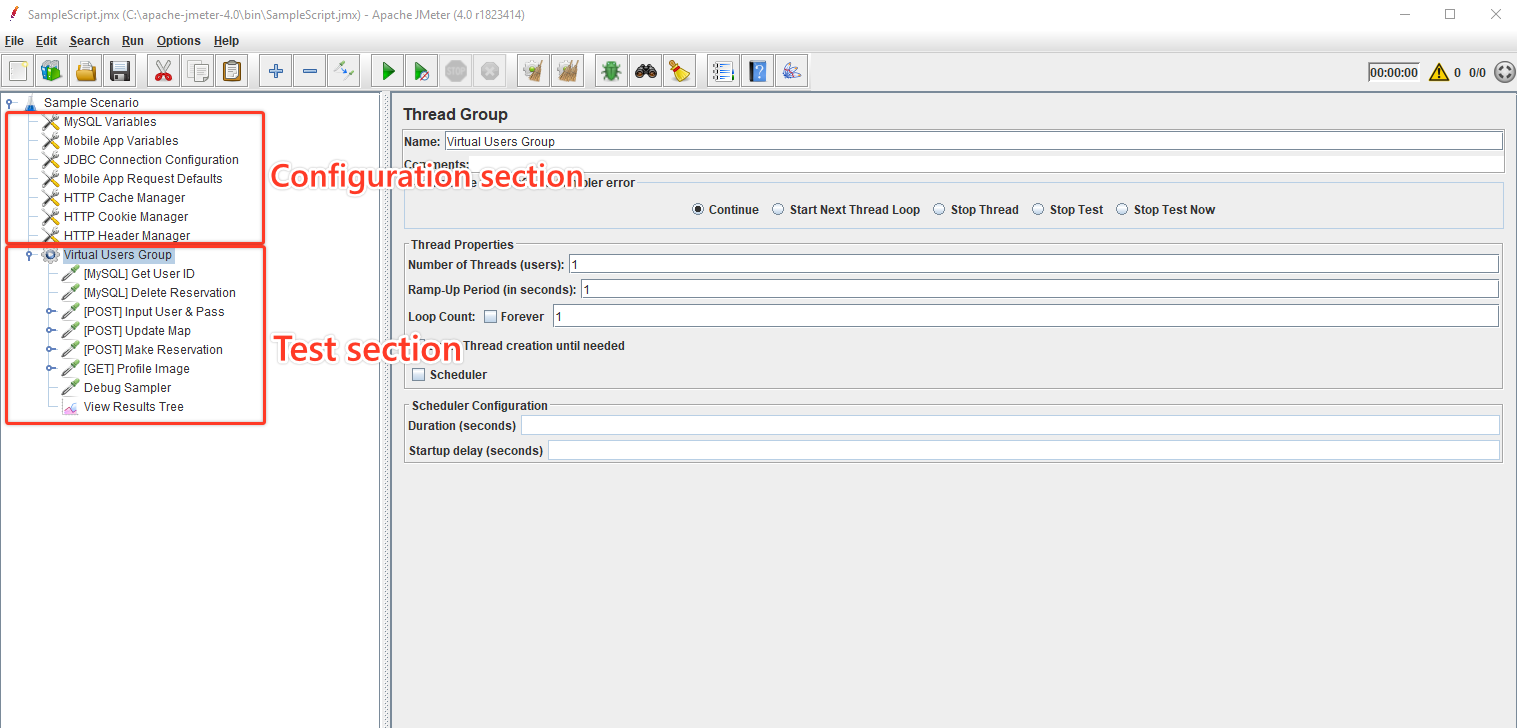
The configuration section:
This part contains all the elements we need to configure in order to be able to run the script efficiently.
- The first 2 elements, the MySQL Variables and Mobile App Variables are used to define all the variables we need throughout the script. It’s usually a good idea to do this here so that our tests are maintained more easily. And, if something changes, we don’t have to look all over the place to make a change.
- The 3rd element, the JDBC Connection Configuration establishes a connection to the MySQL server. We need this in order to make queries and extract certain elements from the DB which we need to use later in the script. In order to use this element, we need to download the JDBC driver for mySQL from here and copy it to the JMeter /lib folder.
- The next one is the Request defaults config element. Here we can set the default protocol, server name, and port number which we want all subsequent requests to inherit. It’s really useful if, for example, the testing server changes. Now you only need to modify the ‘server name’ value in a single element, not for all requests in your test script.
- The HTTP Cache and Cookie managers are used to handle all cache and cookie elements. They’re also used to simulate the user behavior on a browser or app as accurately as possible.
- The HTTP Header Manager is the last element of this section where we need to set the headers which will be inherited by all requests.
The test section:
This section contains the requests we are simulating and all the checks we need to make in order to decide if a test is passed or failed.
- The first 2 elements are MySQL queries.
- One of them retrieves the id of the test user (SELECT id FROM ${dbName}.users where phone = “${mobPhone}”;) which we need for a future assertion (the ‘${}’ syntax is used to call an existing JMeter variable e.g if mobPhone= 12345 then ${mobPhone} will return 12345). The user id is stored in the ‘dbUserID_1’ variable.
- The second SQL query deletes an active reservation of the user if he has one (DELETE FROM ${dbName}.some_table where user_id = ${dbUserID_1} and active = 1;).
- A more elegant approach would be to include these 2 into a ‘Data preparation’ controller along with any other elements similar to them which retrieve or generate data needed for our test.
- Then there is a series of POST and GET requests. Since the application under test uses a REST API, the requests will send and receive json files.
- The first request is a typical login request where we send the phone number and password parameters in the request body. The request contains 4 child elements: one json extractor where we extract the Token variable using the ‘data.accessToken’ expression and store it in the ‘accessToken’ variable. The other 3 elements are json assertions. These assertions are necessary to check if the requests return the expected data.
- The next request updates the map with all areas of interest according to the user position. For this, we send the ‘accessToken’ previously extracted with the request and the user position (lat and long). The coordinates are generally determined by our mobile phone, but since we run the test on a PC, we need to hardcode those 2 values.
- The 3rd request creates a new reservation to a close-by location. The ‘Delete reservation’ query from the beginning is necessary because if the user already has a reservation that didn’t expire, he cannot create another one. This means that the request would have responded with 405 (not allowed) even if the reserve function is working just fine.
- The last request is a simple GET request which retrieves the profile image of a user.
- The last 2 elements are used strictly for debugging purposes and to see what the requests we generated look like. If we compare the requests and responses displayed in the ‘View results tree’ element, they should be the same as the requests we previously inspected in Fiddler.
Of course, this is a basic scenario that only contains a few calls. Some scenarios can get really complex. If we don’t organize them well enough, we can get lost pretty easily. A really cool approach a coworker showed me recently is to group all similar elements (SQL queries, POST request, GET requests etc) in test fragments outside of the Thread group element. Each individual request must have a simple controller as a parent. Then in the Thread group section, you simply define flows that consist of module controllers where you can simply call for requests defined above. This approach is efficient and we avoid having duplicate code especially if there are multiple flows which have a certain common part but this will be elaborated further in a future article.
Finally, we should explore the possible advantages for doing the ideas presented in the previous section.
III. What we have to gain from this approach
There are a few possible advantages to this approach we should take into consideration:
- We gain a better understanding as testers of how the client-server interaction works.
- The bug reports we write can get more accurate since we can better isolate where a certain issue is coming from (backend or UI). This can save time on a project because ping-pong situations (where a bug is passed from the backend to the frontend) are less frequent.
- Designing a smoke test for example is not very time-consuming with this approach. Having such a test brings plus value to a project. Imagine a situation where a quick fix is urgently needed and the test team does not have time to manually run the smoke test. JMeter executes requests from a script sequentially, much faster than any human could and even a vaste smoke test or integration test created in this manner would run really fast. And we would get some immediate feedback regarding the system’s stability.
- Another possible advantage would be that if the testers have basic knowledge of the client-server architecture, it would be a much faster process to learn and design these types of tests than it would be to make end-to-end interface tests with Selenium Webdriver. JMeter has a friendly UI and a huge community and it only requires basic scripting knowledge unless there are really complex tests involved.
- If the application is in its early stages of development, new builds are probably made often and the UI is probably not in its most stable point. A first layer of automation testing with JMeter could bring more value now than a Selenium automation suite which would require a lot of time to maintain at this point.
- If our API tests are correctly designed, if the users of the mobile app under test report an issue and the tests have all passed, this could be an indicator of a bug specific to certain devices (which is more common in my experience on various Android devices). This gives us a direction of where to look and on what devices we should try to reproduce the bug on.
- Another advantage is that such tests have great portability on a multitude of Systems and the configuration process on any system is fast and easy
- These tests in my opinion are a lot easier to maintain than Selenium tests as long as you are familiarised with the JMeter interface and you know what goes on in the script
- For those who are used to various reports similar to those from Serenity/Thucydides, JMeter also offers a wide range of graph results and even HTML reports if you install some plugins. Jmeter reports can be integrated with Grafana as well but that would work best in the context of load testing as far as I know.
- JMeter script can be integrated into a CI suite. I have personally done this with Jenkins, set a cronjob for my script to run every 1h, and if there were any data results which would interest me, I set JMeter to send me an email with that data.
Hopefully, the information presented above will improve the testing effort for those interested in exploring this approach. Even if you are not designing API tests, it’s useful to explore the generated requests from an app while doing manual testing just to gain a deeper understanding of how everything looks behind the scenes. Who knows, it might help us catch some nasty bugs we would have never known about. Happy bug hunting!
by Dragos Campean


