
This document is destined for people who already have a notion of what performance testing means. And it’s also for people who know how to use JMeter (basic knowledge). You’ll find in this article, a guide to JMeter’s Thread Groups.
In performance testing, a very important factor is to try to simulate the actual user behavior as best as possible. A group of virtual users is called a Thread Group in the jMeter application. A thread group is the base element(parent) you need in every test plan. It’s actually an assembly of threads executing the same scenario. There are multiple thread groups available. We configure them in various ways in order to accurately simulate: how users interact with an application, how the load is maintained, and over what periods of time.
These settings derive from what the application clients require from the load tests, data from analytics, and common sense testing stuff.
The latest jMeter updates and plugins came with a few brand new thread groups. All types of thread groups have a common option. It’s the ‘Action to be taken after a Sampler error’ which is pretty much self-explanatory. It can be to continue the thread, start the next iteration, stop the current thread, stop the entire test or force stop the test and all ongoing threads.
Let’s explore each type of thread group along with their specific configuration options. And let’s try to figure out when it’s best to use each of them.
1. Thread Group (the classic)
This is the most basic thread group there is. It has some standard settings and it can be adapted to fit most load test scenarios.
Thread group capabilities and configuration options:
- The number of threads – represents the total number of virtual users performing your test script per execution.
- The ramp-up period – is the timeframe needed for all virtual users to start running their scripts. For example, if you have 30 users with a ramp-up period of 30 seconds, each second, a new virtual user will start performing its “user flow” represented by the created script.
- The loop count – is the number of executions for your script. For example, if the loop count is set to 1 and you have set 20 threads, then the script will run 20 times with the thread start execution delay defined by the ramp-up period. If the loop count is set to ‘Forever’ then new threads will keep starting until the tests are stopped. The condition for this scenario is that you will have a maximum of active threads equal to the value set at ‘Number of threads’.
- Delay Thread creation until needed – if this option is checked, the ramp-up delay and startup delay are performed before the thread data is created. If not, all the data required for all threads is created before starting the actual execution at the beginning of the test.
- The scheduler – you can set a predefined start and end time for your tests. But, you can also a custom duration for situations where you would like to hit the server with a constant load for n Note that the duration option overwrites the start and end times.
Likely scenarios:
- Simple scenarios (load testing) – where you set a predefined number of users and a ramp-up period and you start running your script n.
- Stress testing scenarios – determine the upper limit of the number of concurrent users for your app before it starts to fail.
- Soak testing scenarios – where you can set an expected load for your tests and maintain that load for a predefined period of time.
2. Arrivals Thread Group
This is an open-source custom plugin implemented by guys from BlazeMeter.
Thread group capabilities and configuration options:
- The time unit – This is self-explanatory and can be set to minutes or seconds.
- The target rate – This is where you define the number of new ‘arrivals’ per time unit.
- The ramp-up time – From what I’ve tested, this element is not 100 % accurate since the preview graph doesn’t display the exact number of total arrivals. This happens when the ramp-up line from the preview graph is oblique (not in steps). My recommendation is to ignore this element and always set it to 0. If you do this, the ramp-up will be uniform just like for normal thread groups.
- The Ramp-up step count is correlated to the ramp-up time. And, since the previous element is set to 0, this one won’t matter. It refers to the granularity of the arrivals increase rate => more steps = more smooth patterns. Also, if there’s a really high number of steps then the arrival rate will also display small deviations from what the preview graph displays.
- The hold target rate – This is the duration which you want to run your tests for (how much time you want to keep adding new users each minute).
- Thread iteration limit – This represents the number of loops. I haven’t figured out a use case for this particular feature. So, I usually just leave it blank. This means it’s set to ‘infinite’ until the time limit is reached.
- Concurrency limit – Even if you set 20 new arrivals every minute, if a thread execution lasts 2 minutes, then by the end of the second minute, your app will have 40 active threads. This option helps you limit that number and you don’t have to bother implementing extra scripts to do so.
Likely scenarios:
- Soak testing scenarios – This is where you can set an expected load for your tests and maintain that load for a predefined period of time. You can do this by setting a concurrency limit thus making sure that the number of active threads won’t exceed that.
- Conditioned scenarios where the client might say: ‘The goal is to see how the app behaves if 50 new users access it every minute’. This could be included in a scalability testing scenario provided that the execution time for a thread is more than 1 minute. If a thread’s execution time is longer than 1 minute, or the requests will progressively take longer to respond, then the number of concurrent users will gradually increase thus performing a form of scalability testing. For an even more controlled environment for scalability testing, we will look at the next thread group.
3. Free Form Arrivals Thread Group
This is basically exactly the same as the Arrivals thread group minus the less-used elements like the ramp-up time and ramp-up steps count.
Thread group capabilities and configuration options:
- The time unit – This is self-explanatory and can be set to minutes or seconds.
- The Start and End values – These two should have the same value in my opinion. And they’re the equivalent of the ‘target rate’ from the Concurrency Thread Group. If the start value equals the end value and they’re let’s say 20, and you set a duration of 2 minutes, this means that each minute, you get 20 new arrivals with a constant ramp-up of 3 seconds between threads. If the start and end times are different, I haven’t figured out exactly how the ramping up is done. But, in any case, it’s not too uniform.
- The duration – is the equivalent of the hold target rate from the previous thread group.
- The concurrency limit – is the same as for the Arrivals thread group.
The threads schedule table – This is where you can add multiple rows. Each of them is executed sequentially after the duration of the previous row has expired.
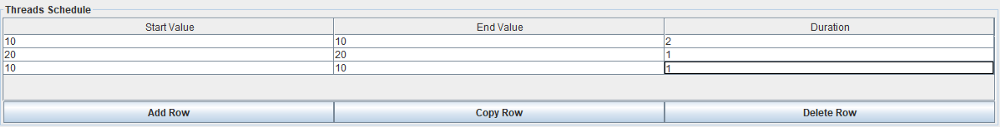
In the above example, the new arrivals execution will be as follows:
- Minute 1: we will have 10 new arrivals (one new arrival every 6 seconds)
- Minute 2: another 10 new arrivals (one arrival every 6 seconds)
- Minute 3: 20 new arrivals (one every 3 seconds)
- Minute 4: 10 new arrivals (one every 6 seconds)
This means that if you only have one row in the ‘Threads schedule’ section, this thread group behaves exactly as the Arrivals Thread Group. To highlight this, I executed the same script which consists of 3 requests. The last 2 have a 1-minute constant timer (1 thread execution lasts 2 minutes) for each thread group.
The settings for the two thread groups were:
- 20 new arrivals each minute – The ‘target rate’ for the arrivals group is 20. The ‘start’ and ‘end’ values for the free-form group are also 20.
- 1-minute hold-up time for the arrivals group and 1-minute duration for the free form group.
What do these settings mean for that particular script?
- All the 20 new virtual users take 1 minute to start their scripts (1 new thread every 3 seconds)
- Since the hold duration is set to 1 min, and that minute expired after all the threads were launched, no new arrivals will be present except for the initial 20 (if the hold time was 2 minutes, then we would have had 40 total arrivals)
- The script execution time is 2 minutes which means:
- the first started thread (thread no 1) will end after 2 minutes from the time we started the test. This is the point where the ramp-down will start.
- the last started thread (thread no 20) will end after 3 minutes from the time we started the test. The test will have ended completely at this point.
- We had 20 concurrent users for 1 minute.
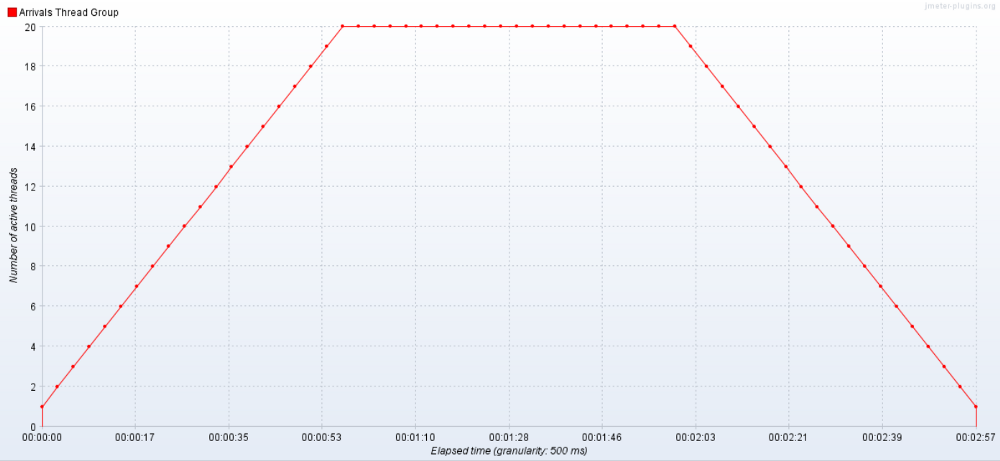
The results from a concurrent number of users perspective, with the settings presented above for the 2 types of thread groups are presented below:
For the Arrivals Thread Group:
For the Free Form Arrivals Thread Group:
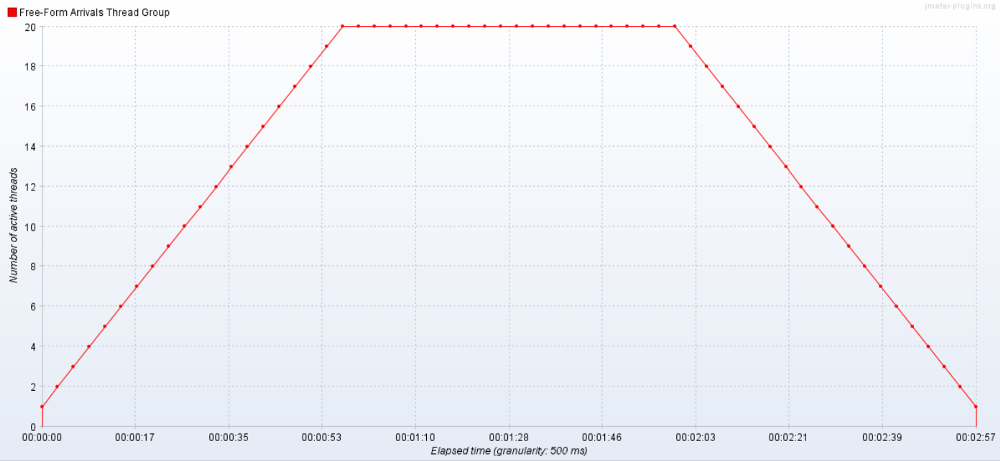
We can see that they’re basically the same.
Likely scenarios:
- Everything you would use the Arrivals Thread Group for
- A more controlled form of scalability testing. Here you always have visibility of how many new arrivals you have each minute.
I mentioned using the last 2 thread groups for a form of scalability testing. I say a ‘form’ of scalability testing because, provided that the test script execution time is relatively low, then the data transfer between server and ‘clients’ won’t be constantly growing, but rather more fluctuating. The only thing which is growing is the number of new threads each separate minute. - Spike testing scenarios — where you can suddenly increase the number of users per minute. Then, decrease it again and see how the application behaves. Using this technique you can also test the recoverability of a certain system.
4. Concurrency Thread Group
This is the perfect type of thread group to help you if your goal is to have control over the number of concurrent users in your app over a period of time.
Thread group capabilities and configuration options:
- The time unit — this is self-explanatory and can be set to minutes or seconds.
- The target concurrency — the number of concurrent users which should be maintained after the ramp up.
- The ramp-up time — It’s the timeframe all virtual users defined in the ‘target concurrency’ field need to start running their scripts.
- The ramp-up steps count — It’s the granularity for starting all the threads needed to reach the target concurrency. Setting this field to 0 means that the ramp-up will be smooth. It also means that threads will have a uniform delay between them. The same result is obtained if this value is really high. A lower number of steps will result in a more ‘rough’ ramp up pattern, where the delay between threads is not too uniform.
- The hold rate time —It’s the duration to maintain the target concurrency before starting to gradually shut down all threads.
Likely scenarios:
- Soak testing scenarios — where you can set an expected load for your tests and maintain that load for a predefined period of time.
Note that everything this thread group does can also be done using the basic Thread Group if you set a constant number of threads, set the loop count to forever, and schedule a duration (I’ve had some issues in the latest versions of jMeter after setting a duration, so instead I’ve set a start and end time for my tests which worked OK so far).
So why use the Concurrency thread group then you may wonder?
- It’s much easier to configure all these settings with this new thread group
- Unlike the basic thread group, this one doesn’t create all threads upfront, it creates them only when needed meaning that extra memory will be saved
- Unlike using the simple thread group, the Concurrency Thread Groupgracefully shuts down all threads, while the Thread Group ‘kills’ them when the ‘end time’ ticks, there’s no ramp-down
- You get a preview of what your concurrency over time will look like just by changing the initial settings. This preview is accurate but it does not include the ramp-down of the virtual users since the threads are not killed and the execution duration of the scripts is different for each test and test run
5. Stepping Thread Group
This is an older version of the Concurrency Thread Group and requires a bit more configuration. Basically, the end result is the same, the only thing that is changed is the way the ramp-up and ramp-down are done differently.
The fields are pretty self-explanatory and filling the input fields is like completing an incomplete sentence: This group will start xx threads (the aimed concurrency). First, wait for xx seconds, then start xx threads, next add xx threads every xx seconds using a xx second ramp-up. Then hold the load for xxseconds (the hold rate time equivalent). Finally, stop xx threads every xxseconds.
In any case, for scenarios where you have to maintain a certain number of concurrent users over a period of time, I suggest using the Concurrency Thread Group since you don’t have to bother with much configuration.
6. Ultimate Thread Group
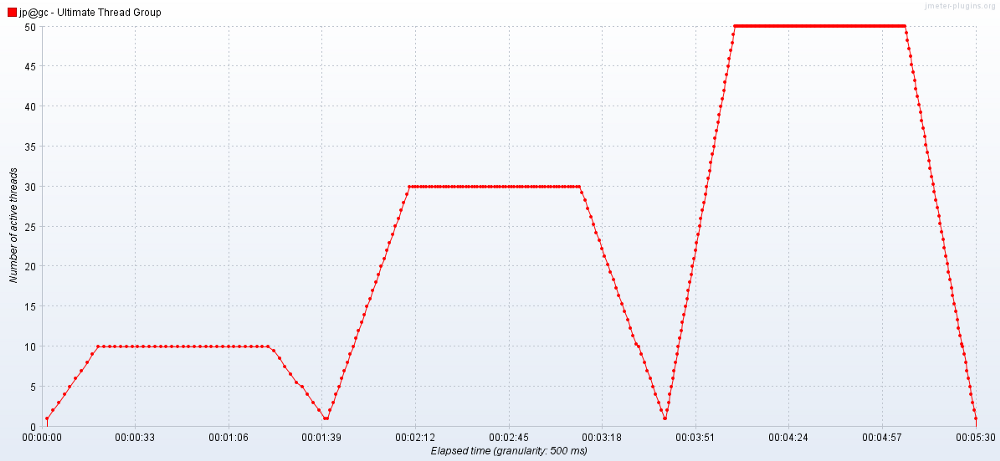
The ultimate thread group is highly customizable and unlike the arrivals, or free-form and concurrency thread groups, this one kills the active threads after the set time has expired. This would translate into real user behavior as the users just close the application tab or browser. This also means that the preview graph showing the expected parallel users will be really accurate since the ramp-down is controlled by the thread group not determined by the execution time of each thread. The thread group also fires up a new thread to maintain the thread count in the situation where one thread has finished executing. See an example of this below:
The preview generated after configuring the thread group:
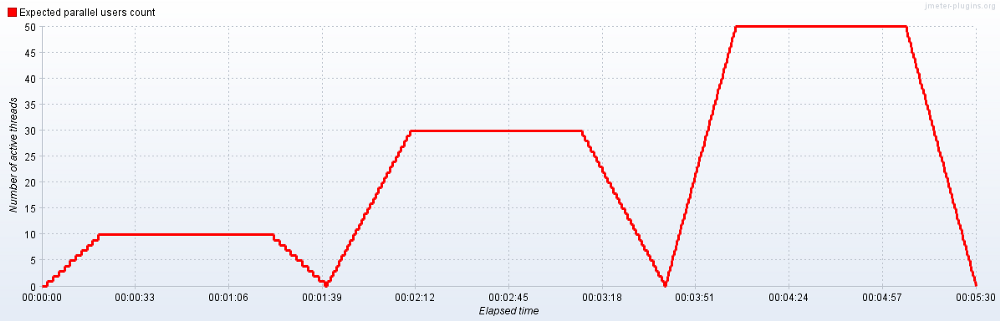
The graph generated after actually running the scripts with the above configuration:
Thread group capabilities and configuration options:
- The threads schedule table — where you can add multiple rows each of them being executed sequentially each of them being started according to the ‘Initial Delay’ setting. This means that the rows (virtual users groups) will be executed in parallel if the ‘Initial Delay’ setting is the same for all fields.
- The start threads count field — where you set the target thread concurrency.
- The initial delay — here you set how much time you wait before starting to execute the threads from that specific row.
- The startup time — represents the ramp-up time for all the threads set in the thread count. For example, for 20 threads and a start time of 20 seconds, you would have 1 new thread firing up every 1 second.
- The hold load for field — this is where you set the duration to maintain the defined number of concurrent users and is totally independent of the ramp-up time.
- The shutdown time — the time interval for killing all the active threads.
You can add multiple rows containing these settings thus resulting in complex patterns which can simulate a fluctuating number of users hitting your servers.
Likely scenarios:
Complex spike testing scenarios — where you can suddenly increase the number of users per minute, then decrease it again and see how the application behaves. Using this technique you can also test the recoverability of a certain system.
In conclusion…
Considering all of the options available for configuring your thread groups, we can safely say that most performance testing scenario needs can be covered by using these groups.
More complex scenarios can be simulated using a combination of the options presented above and if the need arises, the vast open-source jMeter community will probably mobilize to meet those needs.
By Dragos Campean
This was originally published on Medium.