Today, almost everybody has heard the term “Data Science”. If not, they have definitely heard about “AI” which is one of the hot topics at this moment with the likes of ChatGPT. But, as with every complex topic, its full understanding might be hard to grasp for some. Some might even view it as a black box that makes wonders, but it’s far from it. In this article, I want to go over what Data Science is, how it can be applied in real-life scenarios and some considerations to have when looking into Data Science. Maybe this way we can put some light on this “black box”.
What is Data Science actually?
In a nutshell, Data Science is a set of principles, processes, and techniques that help get knowledge out from data, according to the book Data Science for Business. It draws from fields like mathematics, statistics, and artificial intelligence. Also, it provides tools that facilitate the understanding of large amounts of data. Without it, the analysis of that amount of data would be, if not impossible, at least not easy. Certainly not scalable or duplicatable enough to be useful.
To put things into perspective, you can view Data Science more like a flashlight in the night. If you don’t have a flashlight, it will be hard to navigate anywhere during the night. But with the aid of a flashlight, you can light your way and find your destination. Analogy aside, Data Science can help find “destinations”, or better yet answers and solutions to problems by simply analyzing large amounts of data. Not only that, but it can also help to discover solutions none was aware could be possible. For example, Data Science can find a particular group of customers that are more profitable (in the long run) than others, and if the company focuses on them they would have more to gain than to lose. But how can some go about implementing a data science project?
What is the Data Science process?
For anyone interested in Data Science, the following question will come at some point: What would a data science project look like in a real-life situation? This is a hard question to answer, even if it’s a pertinent question to ask. The reason is that no project is the same, so it’s hard to say with certainty what a project would look like. Nonetheless, over the years, a process for data science stood above all others. It’s called CRISP-DM (Cross Industry Standard Process for Data Mining) and it has the following 6 phases:
- Business understanding
- Data understanding
- Data preparation
- Modeling
- Evaluation
- Deployment
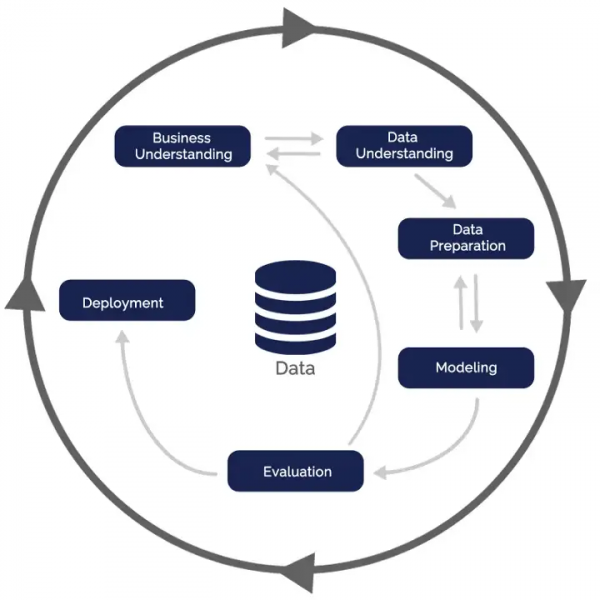
The 6 phases in the Cross Industry Standard Process for Data Mining model (source)
This is the closest someone can come to an answer to the question above, without knowing the details of a project. With this being said, it might be enough to have a big-picture understanding of the data science process. Next, I want to go into more detail to make things clear regarding this process.
Business understanding
In the first phase, everybody gets up to speed on the project’s requirements. It doesn’t matter if it’s an internal team of the company or a collaboration with another company. This step is critical. This is where the scope of the project is determined.
Data understanding
Here, the data is collected and explored. This is where the rubber meets the road because this is the phase where we can determine if the project scope is feasible with the available data, or not.
Data preparation
With the confirmation that the project is achievable, now it’s time to get our hands dirty. In this phase, the data is cleaned and prepared for the next phase. This part is critical, as there is a saying in the data world that goes: “garbage-in, garbage-out”. So, we better get that data cleaned or else nothing good will come at the end of the project.
Modeling
This is the phase that everybody is referring to when they speak about “Data Science”, “Machine Learning”, or “AI”. Basically, certain Machine Learning models are chosen and run on the data cleaned in the previous step.
Evaluation
As the name implies, this phase is about evaluating the models run in the previous step. All models run are evaluated to determine which ones work best for this project. That model moves to the next step.
Deployment
The final phase is more like getting our driver’s license. From now we can drive in the real world. The same is true about deployment. All the preparation done in the previous phases has reached a point where it can run in the real world.
This concludes the last phase of the Data Science process. Now the next question might be regarding some examples of data science results in real-life situations. This is what we will cover in the next section.
How to increase sales by 35% using Data Science?
This is exactly what Amazon has done, according to a Mckinsey study. They have done it through recommendation engines alone. This engine recommends other products that customers might like when visiting the page of a product. Not to mention Amazon’s use of AI or Data Science for optimizing search results, ad placements, Alexa, and many other areas of their business. They are the definition of applying data science to all areas of a business.
Now, why did I choose this example? At first, someone can say that nobody can replicate what Amazon has done, and there might be some truth to it. There is no denying Data Science can help companies. More than that, it’s necessary for companies that plan to stay competitive in the 21st century.
Another thing that stands out from the book Data Science for Business is that companies have to become more “data-driven decision-making” entities. They state that “Data-driven decision-making (DDD) refers to the practice of basing decisions on the analysis of data, rather than purely on intuition.” And, they also say that the more data-driven a company is, the more productive it is. From their research, the differences are significant. In the book, they mention the following “One standard deviation higher on the DDD scale is associated with a 4%–6% increase in productivity”. At the same time, it shows a correlation with a higher return on assets, return on equity, and other aspects of a business. All this is not possible without changing the way we look at data on its own.
Data is the asset.
Without data, everything I’ve stated up until now is worthless. Let me clarify, without high-quality data, no data science tool or framework can obtain useful results. In this study, it is noted that sometimes companies don’t have the required data to sustain proper analysis. In this case, companies might purchase the required data, rather than do the analysis on existing data. Having the data is just the first step.
I will go further and state that it is not enough just to obtain data through in-house means or other acquisitions. Instead, there should be an ongoing effort to maintain that data’s quality. My reasoning is that we live in an ever-changing world. How the world looks today is significantly different than even from 2-3 years ago. The way we work, the way we buy stuff, and our everyday life, in general, have changed. You can see that in this ever-changing environment if we base decisions on data acquired even last year, the results could be misleading.
Summary
To conclude, there is a method behind the madness. There is no black box or witchcraft happening in Data Science. There is a set of tools that provide a better understanding of large amounts of data. Based on that understanding companies can make what are called “Data-drive decisions” to improve their business KPIs. For more information on the topic of data science, check out this YouTube channel. There are a lot of data science concepts explained in a visual way for a better understanding.
Article written by Dumitru Pop